
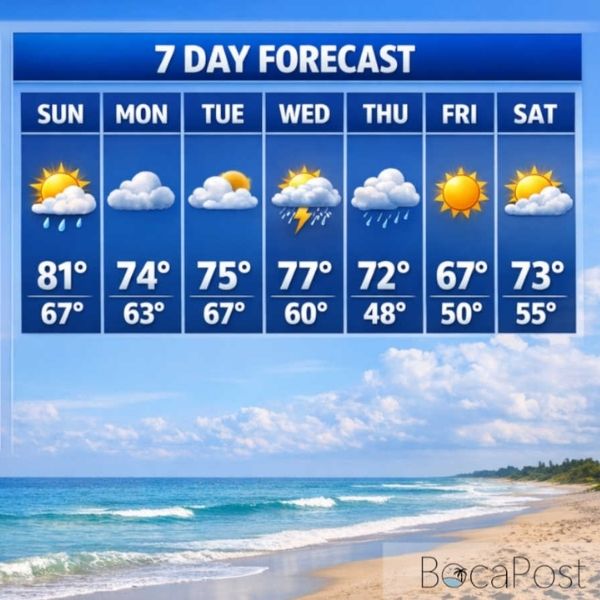
Temperatures in Rockford and Chicagoland are starting to feel like fall, but forecasts suggest a harsh winter ahead.
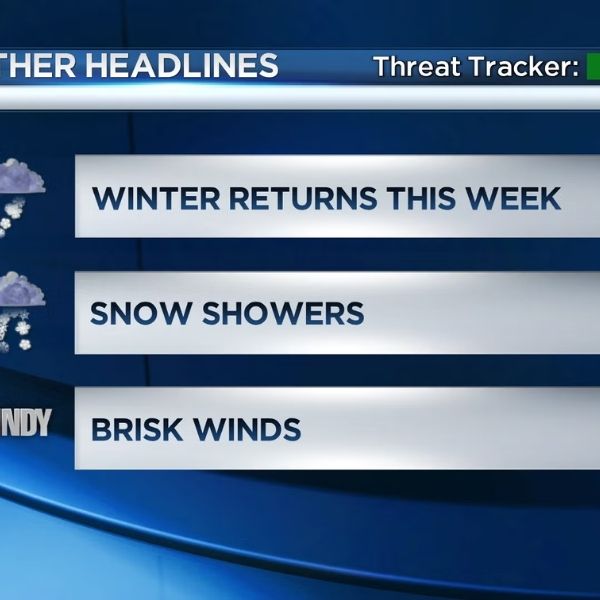
Harsh Midwestern Winter Returns
According to FoxWeather, the La Niña pattern has returned, bringing colder and wetter conditions for the Stateline area. Some models predict 6 to 12 inches more snow than normal across much of Illinois, while Wisconsin could see 12 to 24 inches above average snowfall.
Intensified Cold
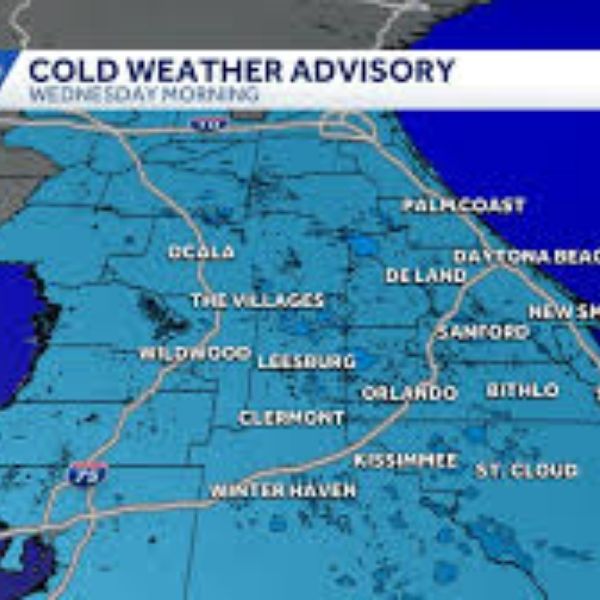
Forecasts indicate that temperatures across Illinois and Wisconsin could remain well below average, with above-average precipitation, setting up for a snowy winter. Forecaster Max Velocity notes the last similar pattern occurred in 2013–2014, which brought well-above-average snowfall.
Regional Impacts
-
Northern Illinois and southeastern Wisconsin could face long, cold snaps and higher-than-normal snow accumulation, especially later in the season.
-
The Farmers’ Almanac warns of “dramatic swings and widespread wintry weather” for much of the Midwest.
-
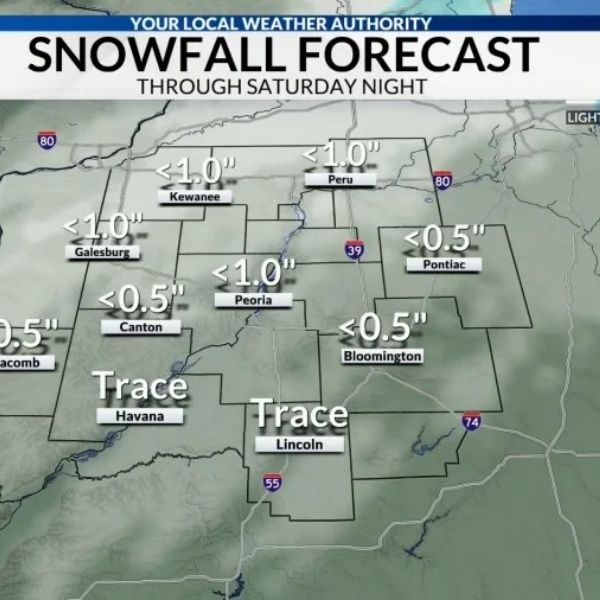
Heavier lake-effect snow is possible in Wisconsin, particularly along Great Lakes corridors, with snowfall potentially more than 2 feet above normal.
Preparation Tips
While October snowfall is unlikely, residents should start preparing snow-removal plans. Local municipalities are also readying equipment for the winter season.
25 Costliest U.S. Hurricanes of All Time
-
#25 Alicia: $8.8B, Cat 3, Aug 17–20, 1983, 21 deaths
-
#24 Opal: $8.9B, Cat 3, Oct 4–6, 1995, 27 deaths
-
#23 Fran: $9.3B, Cat 3, Sep 5–8, 1996, 37 deaths
-
#22 Georges: $10.7B, Cat 3, Sep 20–29, 1998, 16 deaths
-
#21 Floyd: $11.3B, Cat 2, Sep 14–16, 1999, 77 deaths
-
#20 Jeanne: $11.5B, Cat 3, Sep 15–29, 2004, 28 deaths
-
#19 Matthew: $12.1B, Cat 2, Oct 8–12, 2016, 49 deaths
-
#18 Frances: $15.1B, Cat 2, Sep 3–9, 2004, 48 deaths
-
#17 Irene: $17.4B, Cat 1, Aug 26–28, 2011, 45 deaths
-
#16 Hugo: $21.1B, Cat 3, Sep 21–22, 1989, 86 deaths
-
#15 Charley: $24.6B, Cat 4, Aug 13–14, 2004, 35 deaths
-
#14 Laura: $26.0B, Cat 4, Aug 27–28, 2020, 42 deaths
-
#13 Rita: $27.2B, Cat 3, Sep 20–24, 2005, 119 deaths
-
#12 Florence: $27.8B, Cat 1, Sep 13–16, 2018, 53 deaths
-
#11 Wilma: $27.9B, Cat 3, Oct 24, 2005, 35 deaths
-
#10 Michael: $29.0B, Cat 5, Oct 10–11, 2018, 49 deaths
-
#9 Ivan: $31.6B, Cat 3, Sep 12–21, 2004, 57 deaths
-
#8 Ike: $40.2B, Cat 2, Sep 12–14, 2008, 112 deaths
-
#7 Andrew: $55.9B, Cat 5, Aug 23–27, 1992, 61 deaths
-
#6 Irma: $59.5B, Cat 4, Sep 6–12, 2017, 97 deaths
-
#5 Ida: $78.7B, Cat 4, Aug 29–Sep 1, 2021, 96 deaths
-
#4 Sandy: $82.0B, Cat 1, Oct 30–31, 2012, 159 deaths
-
#3 Maria: $107.1B, Cat 4, Sep 19–21, 2017, 2,981 deaths
-
#2 Harvey: $148.8B, Cat 4, Aug 25–31, 2017, 89 deaths
-
#1 Katrina: $186.3B, Cat 3, Aug 25–30, 2005, 1,833 deaths
This article has been carefully fact-checked by our editorial team to ensure accuracy and eliminate any misleading information. We are committed to maintaining the highest standards of integrity in our content.


Leave a Reply