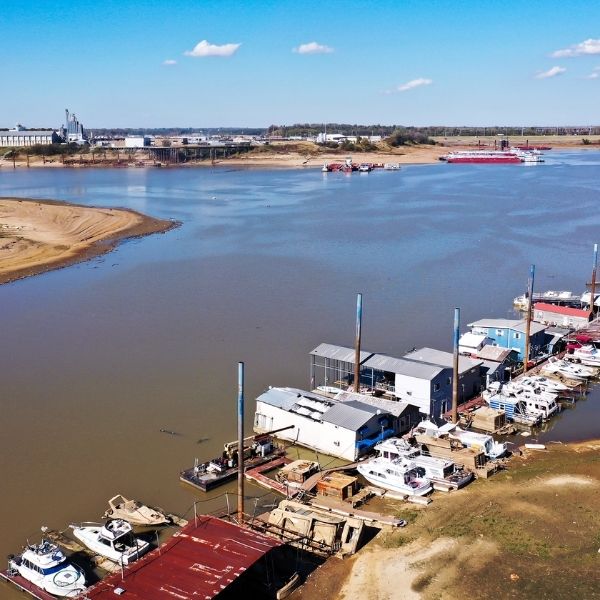
Low river levels are beginning to strand boats at Riverside Park Marina in Southeast Louisiana. While the top and bottom of the Mississippi River have seen high streamflows this month, roughly a quarter of gauges across the basin show below-normal flow.
The new Mississippi River Basin Drought and Water Dashboard provides an easier way to track drought conditions across the basin. Dozens of metrics are used to measure drought, which can make it complicated, but the dashboard consolidates this data in one place.
“Drought doesn’t obey county or state boundary lines,” said Kelsey Eigsti, who co-led the tool’s development at the Cooperative Institute for Research in Environmental Sciences, University of Colorado Boulder. “It crosses regions, so being able to look at the broader regional context is really important for communicating about drought.”
The Mississippi River is one of the world’s busiest commercial waterways and supplies drinking water to more than 50 cities. Two years ago, historically low water levels caused commercial ships to run aground and lowered water quality. This prompted the creation of a dashboard showing past, present, and predicted drought conditions across the basin.
Users can view data for the entire basin, zoom into sub-basin regions, access original data sources, download custom map images, and otherwise customize the information to communicate drought conditions effectively.
The dashboard is a multi-agency collaboration between NOAA, the U.S. Army Corps of Engineers, the U.S. Coast Guard, the U.S. Geological Survey, and state and local partners. It was announced at the annual meeting of the Mississippi River Cities and Towns Initiative and is available at www.drought.gov/watersheds/mississippi-river-dashboard.
The tool consolidates existing data, including current drought conditions from the U.S. Drought Monitor, into a single platform. “We want it more streamlined, easier to understand, so a 12-year-old can grasp it, instead of having to pull data from 10 or more sites,” said Sean Duffy, executive director of the Big River Coalition.
Eigsti explained the dashboard targets drought communicators, such as local governments and journalists, while also supporting decision-makers. It includes educational information on drought impacts.
Missouri State Climatologist Zack Leasor said the dashboard simplifies his work. “This covers the entire hydrologic cycle: precipitation, soil moisture, evapotranspiration, and hydrologic data. It’s a one-stop shop,” he said. Having basin-wide data is useful because conditions in one area can affect upstream and downstream regions.
Low water levels can significantly impact the river. Reduced flow can degrade water quality, allowing saltwater from the Gulf of Mexico to move upriver, affecting drinking water. To mitigate this, the U.S. Army Corps of Engineers sometimes constructs underwater barriers, a measure used in 1988, 1999, 2012, 2022, 2023, and 2024. Low water also slows barge traffic; about 175 million tons of freight move along the upper Mississippi each year.
“The Mississippi River is the primary route for agricultural products from the central U.S. to the country and the world,” said Texas State Climatologist John Nielsen-Gammon. “When the river runs low, barge traffic slows or stops, challenging producers trying to get their products to market.”
Duffy noted that low and high water events are occurring more frequently, reflecting increased “climate variability.” He hopes the user-friendly dashboard will help communicate these trends to the navigation industry. “The channel is king, and everything we do is to protect it and keep everything moving,” he said.
This article has been carefully fact-checked by our editorial team to ensure accuracy and eliminate any misleading information. We are committed to maintaining the highest standards of integrity in our content.


Leave a Reply